Last week, we looked at one key statistic for each American League team. Let’s do the same now for the National League — a key number from the 2019 season and how that will shape what happens in 2020.
NL East
Atlanta Braves
 The number: 4.18. The Braves finished 11th in the majors in bullpen ERA.
For the first half of the season, the Braves’ bullpen was the perceived weak spot of an otherwise excellent team, leading to the deadline acquisitions of Mark Melancon, Shane Greene and Chris Martin. Melancon and Greene were already under team control for 2020, and the club quickly re-signed Martin as a free agent while also adding Giants closer Will Smith with a three-year, $40 million contract. The club also re-signed Darren O’Day, who made just eight appearances in 2019.
On paper, it should be a much better bullpen and a key to the Braves’ hopes of three-peating in the NL East. It’s worth noting, however, that the bullpen was more mediocre than awful in 2019, ranking 11th in ERA and 14th in win probability added (WPA). The Braves also went 83-4 when leading after eight innings (a .954 winning percentage that mirrors the MLB average of .955) and were 11-6 in extra innings. Of course, a good offense can help those results, but the Braves did not suffer an undue number of late-game losses.
The point? Manager Brian Snitker’s life will certainly be easier knowing he can just hand the ball to Smith (although he did allow 10 home runs last season) rather than having a revolving door of closers. The overall effect on the Braves’ win total with a full season from this group might be only a couple of wins, though, with that coming from what happens in the middle innings more so than what happens in the ninth. The Braves’ WPA was 0.52; the fifth-best bullpen via WPA was the Yankees at 3.77. That suggests a three- to four-win improvement if the Braves end up with a top-five bullpen, maybe only a win or two improvement if it remains 10th or so. I’m not underselling the importance there: Three wins could be the difference in what should be a tight division race.
Miami Marlins
 The number: 79. The Marlins had the worst weighted runs created figure in the National League.
I ran this list for the Tigers, the worst offenses of the decade based on wRC+ (100 is league average, so 79 suggests the Marlins were 21% worse than average):
2013 Marlins: 74
2019 Tigers: 77
2019 Marlins: 79
2010 Mariners: 79
2010 Astros: 79
The Marlins have replaced some of the trouble areas with veterans: Jesus Aguilar to play first base, Jonathan Villar to play second or third, Corey Dickerson for left field and Francisco Cervelli to back up Jorge Alfaro at catcher. They could still have the worst offense in the league.
The problems here are obvious:
Alfaro: 154 strikeouts, 22 walks
Isan Diaz: 59 strikeouts, 19 walks
Harold Ramirez: 91 strikeouts, 18 walks
Lewis Brinson: 74 strikeouts, 13 walks
OK, those are all young players, but they’re not super young. Alfaro was 26, Brinson 25, Ramirez 24 and Diaz 23. Given the aging curve in today’s game, those players should be entering their primes, not still figuring out how to hit a breaking ball. We’ll see how new hitting coach Eric Duncan will help. He was hired last year as minor league hitting coordinator and promoted to the big league staff in April when Mike Pagliarulo was fired. The Marlins also brought in James Rowson as bench coach. He was the hitting coach last year for the Twins, so he’ll also work with the hitters. Step one: Improve that chase rate, which was second worst in the majors. Easy to suggest, harder to execute.
New York Mets
 The number: minus-93. The Mets ranked next to last in the majors with minus-93 defensive runs saved, ahead of only the Orioles (minus-105) and a whopping 229 runs worse than the Dodgers, the best defensive team in the majors according to DRS.
I’m not sure I buy into that 229-run difference. Heck, since the Mets allowed 737 runs, this suggests that if you gave the Mets’ pitching staff the Dodgers’ defense, it would have allowed 508 runs, which no team has done in a full season since 1972. Another way to look at it: Since approximately every 10 runs translates to an extra win, that 229-run spread on defense suggests the difference between the 106-win Dodgers and 86-win Mets wasn’t pitching or hitting, but work in the field.
Anyway, no matter how you slice it, the Mets were not a good defensive team in 2019. The metrics at FanGraphs aren’t as extreme but are still bad, with the Mets rating 27 runs below average, 70 runs worse than the top-rated A’s. Amed Rosario was so bad at shortstop early on that reports surfaced in June that the team was working him out in center field. With help from the analytics staff and coach Gary DiSarcina, Rosario did improve, working on his pre-pitch setup and footwork, and was at least average defensively after that. J.D. Davis was legitimately awful at both third base and in left field (a combined minus-20 DRS, which is certainly believable if you watched him play). Center field was a problem. Pete Alonso and Robinson Cano are a step slow at first base and second base, respectively.
The only addition on the position-player side of things is Jake Marisnick, who takes over the Juan Lagares role as right-handed platoon center fielder and defensive replacement. Still, other than Marisnick, the Mets don’t have any above-average defenders. The pitching staff, meanwhile, will have a full season from Marcus Stroman and has added Rick Porcello and Michael Wacha, three pitchers who averaged less than a strikeout per inning in 2019, making them (for this era) pitch-to-contact guys. We’ll see how that trio works in conjunction with a potentially shaky defense.
Philadelphia Phillies
 The number: 2. The Phillies had just two relievers (Hector Neris and Jose Alvarez) throw at least 50 innings.
It was a rough year to be a Phillies reliever. Here are the eight relievers on the Opening Day roster and how many innings they pitched in 2019:
Jose Alvarez: 59
Seranthony Dominguez: 24⅔
Adam Morgan: 29⅔
Hector Neris: 67⅔
Pat Neshek: 18
Juan Nicasio: 47⅓
Edubray Ramos: 15
David Robertson: 6⅔
That adds up to 268 innings, meaning the Phillies needed 316 innings from relievers not on the Opening Day roster (or who might have been in the rotation to start the year). In other words, because of all the injuries, the Phillies had to dig deep into their depth, the waiver wire and trades just to fill the bullpen throughout the year.
So things almost have to be better in 2020, right? Not necessarily. Despite the turnover, the Phillies’ bullpen was actually OK-ish, ranking 16th in the majors in ERA and 15th in win probability added. Given that the lineup was just eighth in the NL in runs and the rotation 11th in ERA, the Phillies were mediocre across the board, which is why they finished 81-81. They might get a better bullpen in 2020, but they also need better offense and better starting pitching.
Washington Nationals
 The number: 139. Anthony Rendon created about 139 runs in his 646 plate appearances in 2019.
Rendon followed up his best regular season with a terrific postseason, batting .328 with a 1.003 OPS while driving in 15 runs in 17 games. How will the Nationals replace his production? Rather than signing Rendon or Josh Donaldson, they went to Plan C, re-signing Asdrubal Cabrera (whom they had acquired during the season) and Howie Kendrick, and signing infielder Starlin Castro and first baseman Eric Thames. Rookie Carter Kieboom will also receive a chance to win a job at either second or third base.
For a simple analysis, let’s give Rendon’s plate appearances to Cabrera and Castro, split equally between the two. Using 2019 numbers, Rendon created 9.5 runs per 27 outs, Cabrera created 5.6 and Castro 4.1. If we give each of the latter two 323 plate appearances, we estimate they would combine to create 81 runs over 646 PAs (while using up 62 more outs than Rendon did). That’s a 58-run difference — or about six wins, and that’s before factoring in defense or whether Cabrera will decline at age 34.
Losing Rendon is a huge, huge blow for the Nationals. Maybe Kieboom steps up and hits as a rookie. Maybe they’ll get more production from first base with a Thames/Kendrick platoon (with Kendrick also playing a little second base). Juan Soto, of course, could put up even bigger numbers. The Nationals were second in the NL in runs in 2019. Without Rendon, it’s going to be difficult to repeat that total.
NL Central
Chicago Cubs
 The number: 90. The Cubs’ core five position players (Javier Baez, Kris Bryant, Anthony Rizzo, Willson Contreras, Kyle Schwarber) combined for an estimated 90 runs created above average.
One of the refrains you hear about the Cubs is that the young position players from the 2016 World Series team haven’t improved since then — or, in some cases, have gotten worse. Using the batting runs stat from Baseball-Reference.com (which estimates how many runs each hitter creates compared to an average hitter), here are the year-by-year combined totals for this group:
2016: plus-79
2017: plus-75
2018: plus-46
2019: plus-90
The group actually had its best season in 2019 — although in 2016, Schwarber was injured almost the entire season and Baez and Contreras weren’t yet full-time players. But the group was definitely much better in 2019 than 2018.
Along those lines, here are the year-by-year totals for the overall runs the Cubs scored beyond the average NL team, with the number in parentheses the resulting total for the rest of the Cubs’ offense beyond the core five.
2016: plus-90 (plus-11)
2017: plus-79 (plus-4)
2018: plus-52 (plus-6)
2019: plus-40 (minus-50)
As you can see, we have similar totals for 2016, 2017 and 2018 for the non-core hitters — slightly above average — but in 2019, the rest of the offense was 50 runs below average. True, the members of the core five haven’t been able to align their best seasons together. Baez was great in 2018, but Contreras had a bad season and Bryant missed time with an injury. In 2019, Schwarber had his best season and Contreras was terrific, but Baez wasn’t as good and Bryant wasn’t quite as good as he was in 2016-17. Still, most of the blame for 2019 should be directed at everyone else — Albert Almora Jr. (minus-16 runs), utility guys Daniel Descalso (minus-16) and Ben Zobrist (minus-5), and Addison Russell (minus-9). Tony Kemp (minus-7) and Jonathan Lucroy (minus-5) came over in trades and didn’t help in limited action.
The third-best hitter on the Cubs in 2019 in terms of runs produced above average was Nicholas Castellanos at plus-15, and he’s gone. The only major league free agent signed was Steven Souza Jr. Yes, it would be nice if the core five were all great at once, but a huge key for the 2020 Cubs is simply hoping the second-tier position players aren’t as awful.
Cincinnati Reds
 The number: 98. That’s Joey Votto‘s OPS+ in 2019. He entered the season with a career mark of 155.
It’s been a fun, busy offseason for the Reds. I wrote a bit about their winter earlier, so let’s instead use this space to talk about one of my favorite players. Votto, of course, had been one of the best hitters in the majors over the past decade, leading the NL in on-base percentage seven times, hitting .311 in his career through 2018, winning the 2010 MVP award and just missing in 2017, when he fell two points short of Giancarlo Stanton. Even when his power tailed off in 2018, he still led the league with a .417 OBP. But the bottom fell out in 2019 with a .261/.357/.411 line. The Reds have theoretically improved their offense with Castellanos and Mike Moustakas, but a better Votto will also help — not an elite Votto, which isn’t realistic at age 36, but even a 2018 semi-elite Votto would be worth an additional two wins at the plate.
What are the odds of that? I found all 35-year-old hitters since 2000 who qualified for the batting title with an OPS+ between 95 and 105. That gave me a list of 17 hitters besides Votto. Two of those didn’t play again (Jermaine Dye and Joe Mauer) and another did it in 2019 (Alex Gordon). The other 14 declined an average of six points in OPS+. The best-case scenario was Carlos Delgado, who went from .258/.333/.448 at age 35 to .271/.353/.517 at age 36.
The projection systems are somewhat optimistic for Votto, with Steamer forecasting a .270/.382/.451 line. That’s definitely playable. If Votto struggles like Greg Vaughn (103 OPS+ to 62) or Ryan Howard (96 to 85) did, however, then the Reds have to consider a backup plan at first base. If Votto’s downward trend continues, do you stick with him all season just because he’s Joey Votto?
Milwaukee Brewers
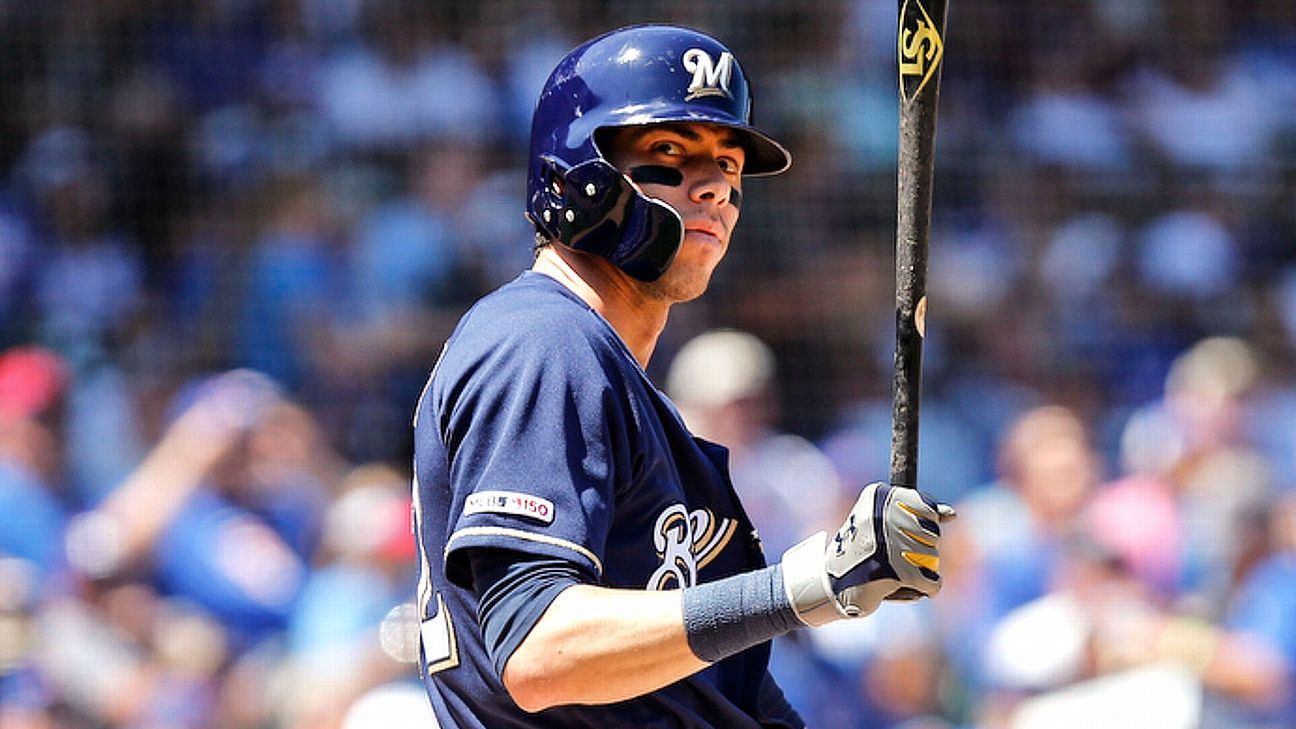
 The number: 1.100. Christian Yelich hit .329/.429/.671 for a 1.100 OPS and finished second in the MVP voting.
Given that MVP Cody Bellinger slowed down the final two months, it seems likely that if Yelich hadn’t fractured his kneecap on Sept. 10 and missed the Brewers’ final 18 games, he would have won his second consecutive MVP award. Since Barry Bonds had his last monster season in 2004 — let’s call that the end of the steroids era — there have been only five seasons when a player has had an 1.100 OPS, three of them by Albert Pujols:
Pujols, 2006: 1.102
Pujols, 2008: 1.114
Pujols, 2009: 1.101
Bryce Harper, 2015: 1.109
Yelich, 2019: 1.100
It wasn’t just the rabbit ball. Yelich improved relative to the league. The most impressive thing is he adjusted even as pitchers challenged him less often — his rate of pitches in the strike zone fell from 48.6% to 41.8%. Only Pete Alonso (41.7%) saw a lower percentage of pitches in the zone. On top of his hitting, Yelich stole 30 bases in 32 attempts, making him just the 13th 40/30 player in history. (Ronald Acuna Jr. also joined the club in 2019.)
What’s in store for 2020? More of the same, I would expect, assuming no lingering issues from the injury. Yelich had the fifth-highest average exit velocity, and combined with a much more optimal average launch angle (4.7 degrees to 11.2), more of those line drives left the park. He’s my preseason choice for NL MVP and a potential Triple Crown winner. Assuming he gets any pitches to hit.
Pittsburgh Pirates
 The number: .314. Bryan Reynolds hit .314/.377/.503 and finished fourth in the Rookie of the Year voting in a loaded NL class.
It’s easy to go negative on the Pirates, and the recent Starling Marte trade suggests they are throwing in the towel after a 93-loss season. So let’s go positive and talk about Reynolds, one of the biggest surprises of 2019. Acquired from the Giants in the Andrew McCutchen trade, the Vanderbilt product hit .302 at Double-A in 2018, although with just seven home runs in 88 games. Baseball America ranked him the No. 9 prospect in the Pittsburgh system, and he began 2019 in Triple-A. He got called up in late April when Marte went on the injured list and hit .322 in May, .369 in June and was at .332 through August before slumping in September.
How legit was Reynolds’ season? He did rank third among qualified hitters in BABIP, with a .387 average that trailed only White Sox teammates Yoan Moncada and Tim Anderson. Still, there is a long list of positives in his hitting profile: Exit velocity and hard-hit rate were slightly above the MLB average, his line-drive rate was above the MLB average, his plus speed helped him to 16 infield hits, and his chase rate was right at MLB average (not bad for a rookie who basically skipped Triple-A). He hit .314 and his expected batting average via Statcast based on the quality of his contact was .296. Reynolds can hit. He’s very aggressive in the zone, and if he can lay off some off the off-speed stuff off the plate, I see more .300 seasons in his future.
St. Louis Cardinals
 The number: 0.91. Second-year starter Jack Flaherty posted a 0.91 ERA in the second half as he held batters to a .142 average over 15 starts.
While much of the offseason talk around the Cardinals centered around improving an offense that ranked just 10th in the NL in runs, in order to repeat as division champions they will likely need another big season from Flaherty, who finished fourth in the Cy Young voting after going 11-8 with a 2.75 ERA. Is Flaherty’s monster second half a sign of more dominance to come? Remember that last offseason there was similar talk about Zack Wheeler, who had a 1.68 ERA in the second half of 2018 but finished 2019 with a 3.96 ERA.
ESPN Daily Newsletter: Sign up now!
To see what we might expect from Flaherty, I checked the 20 lowest second-half ERAs since 2000 — or 18, since two of them occurred in 2019 (Flaherty and Jacob deGrom) — to see how those pitchers fared the following season. The list includes three Clayton Kershaw seasons and two from Johan Santana.
Only four of the 18 pitchers posted a lower overall ERA the following season — Kershaw twice (2.13 to 1.69 and 1.83 to 1.77), Santana (2.87 to 2.77) and Pedro Martinez (2.26 to 2.22). The average increase was 0.72, which would raise Flaherty’s season-ending ERA of 2.75 to 3.47.
It’s worth noting that Flaherty’s ERA was the second lowest on the list, behind only Jake Arrieta‘s 0.75 in the second half of 2015. (Arrieta’s 2016 ERA rose from 1.77 to 3.10.) Flaherty’s overall ERA of 2.75 was 17th highest on the list, however, so none of the others had such a big difference between their two halves. Maybe, like Arrieta, Flaherty simply had a half-season for the ages, but I would bet on another sub-3.00 ERA in 2020 and like him as a true No. 1 starter moving forward.
NL West
Arizona Diamondbacks
 The number: 4.83. The Diamondbacks ranked 23rd in the majors with a 4.83 ERA in the seventh and eighth innings.
After they acquired Starling Marte, adding to their earlier offseason additions of Madison Bumgarner and Kole Calhoun, I wrote about how I like where the Diamondbacks are headed coming off an 84-win season, with a more versatile lineup, a better outfield and good rotation depth. I didn’t mention the bullpen because the bullpen had some issues. Now, seventh- and eighth-inning ERA isn’t everything — the Nationals ranked 29th in the majors in that department and won the World Series — but you’d obviously rather be at the top of this list than at the bottom. Seven of the top 10 teams in this stat won 90-plus games. In 2018, seven of the top 10 won 90-plus games.
The Diamondbacks were actually pretty good in this area in 2017 and 2018. In 2017, when they won a wild card, they ranked seventh in the majors. In 2018, they ranked eighth. Archie Bradley was a huge key in 2017, posting a 1.18 ERA over 61 innings in the seventh and eighth innings. In 2018, the D-backs received good work from a nondescript group of relievers that included T.J. McFarland, Yoshihisa Hirano and Andrew Chafin. That group wasn’t as good in 2019, and Bradley had to replace the struggling Greg Holland as closer.
For 2020, Arizona has signed Junior Guerra, who had a 3.55 ERA for the Brewers, and Hector Rondon, who had a 3.71 ERA for the Astros but saw his strikeout rate plummet. Maybe Taylor Widener, who struck out 176 in 137⅓ innings at Double-A in 2018 but got lit up at Triple-A Reno (8.10 ERA), can help as a reliever. Jon Duplantier was a onetime hot prospect as a starter who could become an impact reliever. Whatever the names, if manager Torey Lovullo can build a late-game bullpen, the D-backs will win more than 84 games in 2020.
Colorado Rockies
 The number: 31-57. The Rockies were 40-34 through June 20, leading the wild-card race at the time. The Rockies would go just 31-57 the rest of the way to finish 71-91.
It all began with a three-game weekend sweep at Dodger Stadium, all three walk-off losses. It got really ugly in July and August, as the Rockies went 15-38 and were outscored by 115 runs those two months — more than two runs per game.
Because of the way the streak started, with those bullpen defeats, the pen took much of the blame for the collapse. (And it was a bad bullpen, with a 5.14 ERA that ranked 28th in the majors. It was a little better by win probability added, ranking 19th.) When you’re outscored by two runs per game, however, it’s a complete team effort, and the lack of organizational depth showed up in those two months.
Obviously, it didn’t help that Kyle Freeland (6.73 ERA) fell apart after finishing fourth in the 2018 Cy Young vote, but his replacements were awful as well — Peter Lambert (7.25 ERA in 19 starts), Jeff Hoffman (6.56 ERA in 15 starts), Chi Chi Gonzalez (5.43 ERA in 12 starts). Antonio Senzatela (6.71 ERA) struggled. Add in Tyler Anderson‘s knee surgery after five starts (after making 32 starts in 2018) and the Rockies simply had to dig too deep into an area where they lacked depth.
The offense struggled as well. The Rockies scored 835 runs, but that ranked just fourth in the NL, which doesn’t cut it for a Coors Field team. It was their first time out of the top two since 2012 and first time out of the top three since 2008. Their park-adjusted wRC+ of 86 ranked 26th in the majors.
So with holes all over the roster, what have the Rockies done? Nothing. They have some bounce-back candidates in Freeland and perhaps Daniel Murphy, and I liked Garrett Hampson as a prospect, but they still have Ian Desmond and no offense at catcher and the same group of starters and relievers. I guess the thinking is this group won 91 games and lost the NL West in a tiebreaker in 2018 and that 2019 was one of those seasons where everything went wrong. Indeed, that seems to be the feeling of owner Dick Monfort, who recently said this at an offseason event:
“In ’08, with basically the exact same team, we won 74 games and lost 88. But like a great American hero, Forrest Gump, once said, ‘[Stuff] happens.’ And that’s what happened in ’08, because in ’09 we won 92 and lost 70. Most of the people I talk to that were on those teams say the ’09 team was our greatest team.
“I interpolated ’07, ’08 and ’09 — I had an analytical staff go through and interpolate those numbers — and so in 2020, we’ll win 94 games and lose 68.”
And you wonder why Nolan Arenado wants out?
Los Angeles Dodgers
 The number: 3.44. The Dodgers had a 3.44 ERA in the eighth inning in the regular season, fifth best in the majors.
The eighth inning, of course, is when Game 5 of the division series against the Nationals unraveled as the Dodgers blew a 3-1 lead when Clayton Kershaw allowed back-to-back home runs. The Dodgers would lose the game in 10 innings when Howie Kendrick belted a grand slam off Joe Kelly. Even then, closer Kenley Jansen didn’t enter the game until two batters later.
The question: Did manager Dave Roberts (and the front office, which obviously worked with him on a game plan for various scenarios) need to think outside the box and use Kershaw? Or should Roberts have gone with the guys that helped win 106 games in the regular season? Pedro Baez had pitched in the eighth inning most often in the regular season and pitched well, with a 2.04 ERA over 35⅓ innings. Roberts had lefties Adam Kolarek (who could have faced Juan Soto) and Julio Urias still available.
It seems clear that Roberts was affected by what happened in Game 4, when Urias allowed three hits to five batters while facing the top of the Washington lineup. Baez replaced Urias in that game and allowed a three-run home run to Ryan Zimmerman. Instead of mixing and matching or using Kenta Maeda, the Dodgers tried a new plan in their biggest game of the year. Maybe that idea was also a reaction to Game 4 of the 2018 World Series, when the Dodgers blew a 4-0 lead in the final three innings as Roberts churned through six relievers.
The other factor, however: While that 3.44 ERA in the eighth inning looks solid enough, the Dodgers’ bullpen wasn’t clutch when it mattered most, ranking just 21st in win probability added. Roberts simply didn’t trust his setup guys or, in the end, Jansen.
In a sense, given the depth and talent here and the likely division title, the regular season will simply be a prelude to the Big Question: How will the bullpen do in October? Jansen is still the closer. Baez, Kelly, Kolarek and Dylan Floro are still here. Urias might start or might pitch in relief come the postseason. The best hope (and solution) is that free agent Blake Treinen finds his 2018 form and becomes a dominant reliever — and that Jansen bounces back. Given that Jansen has a 3.34 ERA and 22 home runs allowed over the past two seasons, his days as an elite closer might be over. October is a long way off, but the bullpen question will linger all season.
San Diego Padres
 The number: 3.1. Manny Machado tied for 77th among position players in WAR at 3.1, according to Baseball-Reference.com.
The Padres improved from 66 to 70 wins in 2019, but that was a bit of a disappointment when factoring in that they signed Machado, had strong rookie seasons from Fernando Tatis Jr. and Chris Paddack, and had an All-Star closer with a 1.19 ERA.
Machado was hardly the only reason the Padres didn’t climb closer to .500, but his .256/.334/.462 season in a high-offense year wasn’t what you’d expect from a $300 million player in his prime. Machado got off to a slow start, played better in May, had a monster June with a .314 average and 11 home runs, but then hit .209 with six home runs over August and September. Did he lose interest as the Padres fell out of the race? Was he playing through some nagging injuries? Did the weight of the big contract wear him down? Machado struggled at home (.219/.297/.406), hit just 21 doubles and led the NL by grounding into 24 double plays.
What are the hopes for 2020? There isn’t a lot of bad luck built into his numbers. He hit .256 versus a Statcast expected average of .266 based on the quality of his contact. He slugged .462 versus an expected slug of .466. Machado had a high average exit velocity (87th percentile) and a better-than-average strikeout rate, but his high popup rate (10.6%) ate into his batting average, and the move away from Camden Yards — where he thrived in the home run department — hurt his power numbers. His line-drive rate was also the lowest of his career, which explains the big drop in doubles.
It’s hard to gauge who Machado is at this time. His numbers the past four seasons:
2016: .294/.343/.533, 130 OPS+, 6.9 WAR
2017: .259/.310/.471, 108 OPS+, 3.5 WAR
2018: .297/.367/.538, 145 OPS+, 5.7 WAR
2019: .256/.334/.462, 109 OPS+, 3.1 WAR
The Padres paid for 2018 Machado and got 2017 Machado. That’s still a good player: durable, plus defense, 30 home runs. The Padres just hope they get a star turn from Machado in 2020 and those additional three wins or so.
San Francisco Giants
 The number: 29.9. Using Baseball-Reference.com’s weighted average age (adjusted for playing time), the Giants had the oldest group of position players in the majors, with an average age of 29.9. Under the previous front-office regime, the Giants tried to push the core of an aging roster as far as it would go. They won a wild card in 2016, the first year after giving big free-agent contracts to Johnny Cueto and Jeff Samardzija, but it’s been three straight losing seasons since then. If anything, the 77-85 record in 2019 was a surprise (thanks to a terrific bullpen, the Giants overachieved their Pythagorean record by six wins).
Not surprisingly, it’s been a quiet offseason for Farhan Zaidi. It’s an old team with a mediocre (although improving) farm system and a big payroll. There wasn’t really any reason to do much. The Giants could try to push from 77 to 85 wins and still end up winning 65. There aren’t many trade options either: The veterans make too much and weren’t that good. The team’s best player was a 28-year-old rookie outfielder (Mike Yastrzemski). It appears the first year of the post-Bruce Bochy era will look a lot like Bochy’s final year. Good luck to new skipper Gabe Kapler.
